
How many threads?
You have an application. You add threads to improve throughput. But how many threads do you add? Do you go for a fixed number, or you compute this dynamically?
We try to articulate an answer in this post.
This time we’ll do it a bit differently: we show a test, we draw the conclusion and then we go and explain the rule and why it applies.
Contents:
The test
Let’s start with a test. Following Performance analysis of multithreaded applications by Denis Bakhvalov, we test h264dec (obtained from Starbench parallel benchmark suite).
I’ve compiled it for my MacBook Pro (Retina, 15”, late 2013, 2GHz quad-core Intel i7, with 8GB 1600 MHz DDR3, macOS Catalina) with the following command:
../configure --enable-sdl2
I went against the readme file and didn’t specify --enable-ssse3 flag. Also, I had to comment out setting the thread affinity, as that pthreads API doesn’t work on macOS. Other than that no changes. I’ve tested with the big_buck_bunny_1080p24.h264 video, and varied the number of threads from 1 to 12. I’ve used time to measure the execution time (and CPU usage).
Test results
| Num threads | CPU usage | Total time |
|---|---|---|
| 1 | 99 | 4:52.96 |
| 2 | 198 | 2:28.48 |
| 3 | 294 | 1:38.48 |
| 4 | 388 | 1:15.06 |
| 5 | 489 | 1:29.35 |
| 6 | 585 | 1:17.47 |
| 7 | 678 | 1:08.68 |
| 8 | 766 | 1:05.37 |
| 9 | 793 | 8:26.45 |
| 10 | 793 | 17:01.64 |
| 11 | 792 | 22:53.27 |
| 12 | 793 | 28:41.83 |
First, let’s plot the CPU usage:
The early conclusions that we can draw from this graph are:
- for each thread that we specify when invoking
h264dec, we get roughly 100% of CPU utilization - my machine, using Hyperthreading, has 8 cores that it can utilize
- we max out the CPU utilization when we have 8 threads; after that, there is no extra hardware that we can consume
Now, let’s look at the total completion time:
From this plot, we can draw the following conclusions:
- up until 8 threads the total execution time tends to decrease when increasing the number of threads
- there is a hiccup when switching from 4 to 5 threads (Hyperthreading effects?)
- going above 8 threads seems to severely reduce the performance of the application
- the best performance is achieved with 8 threads
We can better visualize the data if we show the speedup (total time divided by the number of threads):
Analyzing this plot leads us to the following:
- we get very close to linear speedup (ideal) up to 4 threads
- between 5 and 8 threads we get sub-optimal speedup, but we still see some speedup with the addition of new threads
- most probably this is caused by Hyperthreading effects; I will not investigate any further
- the speedup is less than 1 for more than 9 threads
The optimal number of threads
Rule
To achieve the best throughput, an application should have a number of threads equal to the number of cores in the system, assuming that the threads are CPU-intensive.
First, we need to make sure that we apply this rule to maximizing the throughput of the application. That is, we want to do as much work as possible in the shortest amount of time. The rule does not apply in low-latency situations (we want the fastest response time for a given action).
Then, it must be the case that the threads that we are operating with are CPU-intensive. If the application has other threads that are mainly waiting, then the rule does not apply. Indeed, the h264dec application that we’ve analyzed creates more threads than we actually specify (an output thread, a parse thread, a reorder thread and the main thread), but these threads are mostly waiting. The best example is the main thread that creates the other threads and then waits for them to complete; it doesn’t do any actual work, so the OS will not dedicate any resources to it.
Let’s now analyze the rule from multiple points of view, and see when and why it’s true.
Discussion
Static number of threads vs dynamic number of threads
How should an application set the number of threads? Can it use a fixed number like 8?
Well, the answer is clearly NO. The application is built once, and typically it runs on different hardware. That means that one doesn’t know the number of threads upfront.
If one sets the number of threads too low, then the program doesn’t take full advantage of the hardware. If one sets the number of threads too high, then it may reach the case above in which the throughput drops significantly.
The upper limit
It is clear why configuring a lower number of threads hurts throughput. But why can’t we add more threads than the number of cores? Can’t the OS handle it? Shouldn’t it be better?
First, let’s be clear on the theoretical maximum. If we have N cores, we cannot gain more speedup by scheduling more than N independent thread of CPU-bound work. We simply cannot utilize more than the hardware availability.
But can we schedule more than one thread per core, and let the OS rotate the threads it assigns to the CPU? Yes, we can, but that doesn’t improve performance; actually, most of the time it will degrade the performance.
Let’s assume that we have 2 CPU-intensive tasks that both take 1 second if executed independently. If we try to squeeze their execution into one core, what we get is both tasks completing in 2 seconds (assuming ideal conditions). It would have been better to execute them serially; then we would have 1 task complete after 1 second, and the other one complete after 2 seconds (i.e., 1 task would complete earlier).
A more realistic upper limit
Previously we discussed scheduling multiple threads on the same core in ideal situations. But, in reality, things will tend to be worse.
Here are the main factors that affect this:
- thread switching takes time – if one does a lot of thread switching, then that time will add up to the detriment of performance
- lock waiting increases with the number of threads – the more threads one have that tries to access one shared resource, the more the threads will wait on that resource
- in general, the presence of shared resources will tend to be a limit factor; on some platforms, the memory allocator can be such a bottleneck when increasing the number of threads (for example, see this, this and this)
- I/O can be a limiting factor, on certain platforms (as it’s a shared resource)
- cache locality – each time the thread is switched on one core, one loses locality; these effects can be disastrous for some types of applications
- false sharing – for example, see Avoiding and Identifying False Sharing Among Threads
- indirect synchronization (i.e., synchronization without locks) – some applications do more work if certain conditions are not met
And the list can go on.
In practice, different threads tend to perform operations on the same data, with the same resources. So there is always great potential for sharing, which will lead to sub-optimal scalability. It’s very hard to write near-perfect scalable software.
So, empirically we can say that the more threads we have, the more contention we have. This leads to degraded performance.
So, when crossing the limits with too many threads, we stop getting any benefits, but we are still paying the costs of contention.
What happens in the case of h264dec?
After performing the above measurements, I went to check why do we have the slowdown. I used Tracy Profiler to instrument the application, and check where the time is spent. I compared the execution trace between running with 8 threads and 9 threads.
Please note that, by adding instrumentation, we increased the execution time of the program. The more zones we add, the more we skew the results. But, as we are comparing two different runs of the same program, the skews are the same, so we can trust the comparison results.
First, let’s look at the statistics:
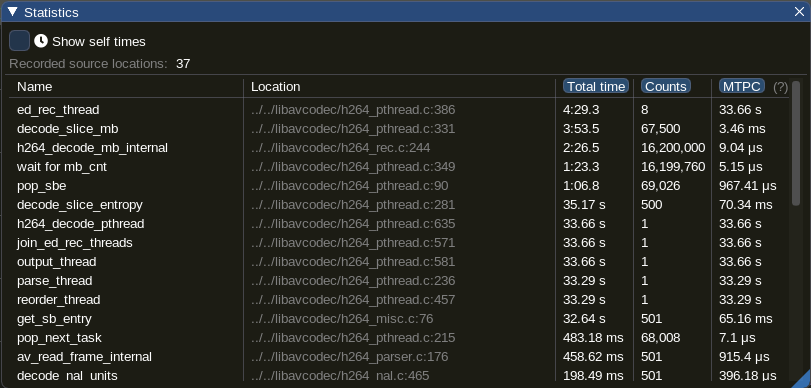
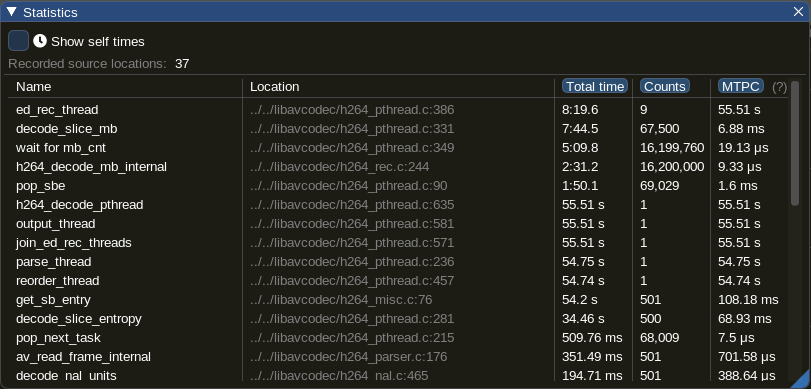
One can immediately see big differences between the two runs:
-
ed_rec_thread– 1 zone for each thread that does the heavy-lifting- the time almost doubles
-
decode_slice_mb– we seem to spend here the vast majority of the time- again, the time almost doubles
-
wait for mb_cnt– inner waiting loop in thedecode_slice_mbfunction- here the time goes up from 1:23 to 5:09 – that is, increased 3.7 times
- note that the number of calls remains constant
- the main difference in the total time seems to come from the
wait for mb_cntzone
Tracy Profiler also has the functionality to compare captures. If we use it against the wait for mb_cnt zone, we find:
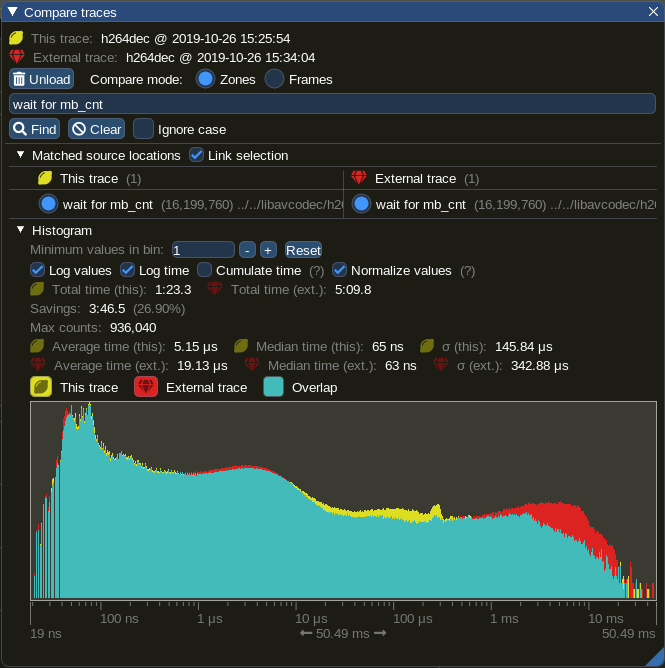
We can draw the following conclusions:
- the median is roughly the same
- the average is much higher in the case of 9 threads
- we seem to have larger variability in the case of 9 threads
- we see an accumulation of zones for the buckets with higher duration (see the red zone on the right side of the graph)
Ok, we have now more information about what’s going on; it’s time to look at the code. We are showing below the decode_slice_mb function:
static int decode_slice_mb(MBRecContext *d, RingLineEntry *rle, int frames){
    PROFILING_ZONE_START()
    SliceBufferEntry *sbe= rle->sbe;
    H264Slice *s = &sbe->slice;
    H264Mb *mbs = sbe->mbs;

    int mb_width= d->mb_width;
    int i;
    const int line = rle->line;

    init_mbrec_context(d, d->mrs, s, line);

    H264Mb *m = &mbs[line*mb_width];
    d->top=rle->prev_line->top;
    d->top_next=rle->top;

//     assert(rle->mb_cnt ==0);
    for(i=0; i< mb_width; i++){
        if (frames || line>0){
            PROFILING_ZONE_STARTN(zoneCtx, "wait for mb_cnt");
            while (rle->mb_cnt >= rle->prev_line->mb_cnt -1);
            PROFILING_ZONE_ENDN(zoneCtx);
        }
        h264_decode_mb_internal( d, d->mrs, s, &m[i]);
        rle->mb_cnt++;
    }
    draw_edges(d, s, line);

    PROFILING_ZONE_END()
    return 0;
}
In here, the lines with PROFILING_ZONE_ were added by me in the process of instrumenting with Tracy.
Let us look more closely to the while loop inside the for loop:
while (rle->mb_cnt >= rle->prev_line->mb_cnt -1);Wait, what?
We have a loop that doesn’t do anything, doesn’t change any value, and consumes CPU in the meantime (busy-loop).
It turns out that this is an indirect synchronization between threads. One thread cannot continue unless some other thread (working on a different line) has made significant progress.
Most of the time the loop is very fast: the median is 65 ns, with profiling (if we remove profiling, this would be even faster). But, when we add too many threads, it seems that it has instances when it takes too much time. Indeed, if we look at the timeline, we find things like this:
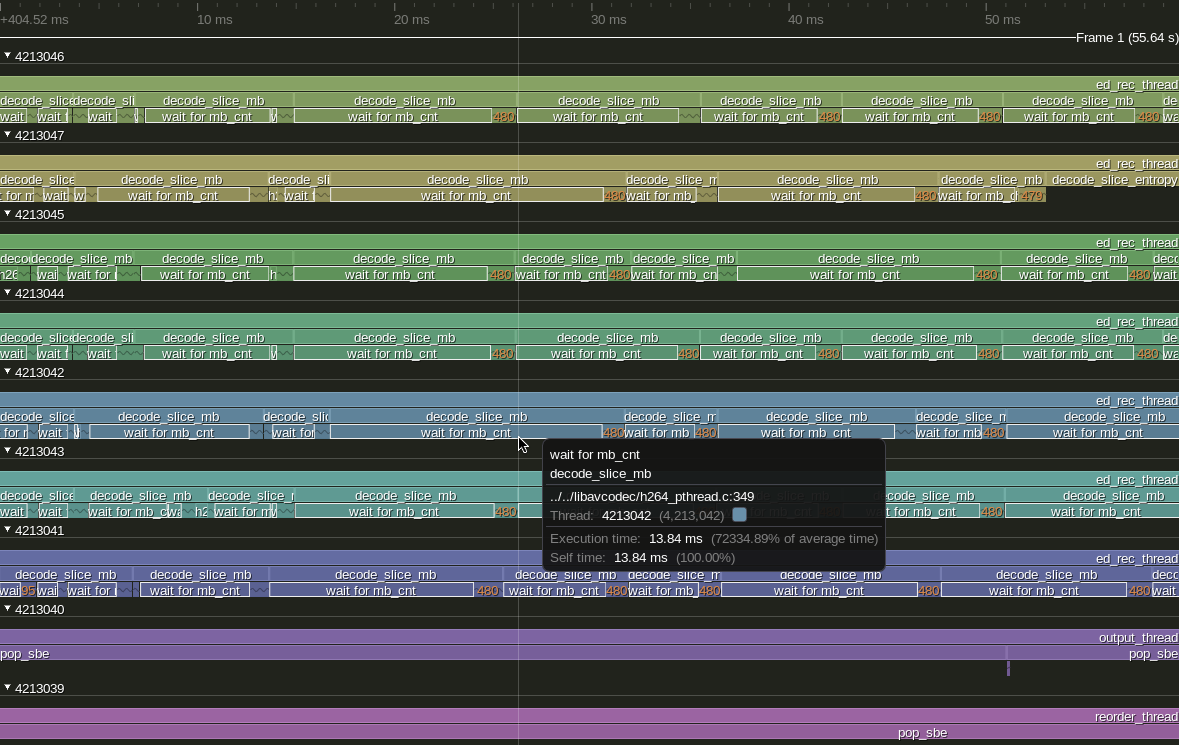
In this example, we have a decode_slice_mb call dominated by a wait_for_mb_cnt zone which takes 13.84 ms. And the pattern repeats a lot in the execution. Also, what’s interesting is that around those areas where a number like 480 is displayed with orange, if we zoom in, we can find a lot of h264_decode_mb_internal, each with a corresponding wait_for_mb_cnt. So, within decoding the same slice, we have very fast waits, and typically one very slow wait at the beginning.
So, we see how adding more threads will make the application’s inner synchronization to decrease the overall throughput.
To be fair, this is not a very typical way of synchronization, but still, it serves proving our point.
The double-edged sword of I/O
So far we’ve been discussing the case where the threads are CPU-intensive. But what happens with the threads that do part CPU part I/O?
Personally, I heard a lot of arguments like: if the thread is doing a reasonable amount of I/O, then the CPU is free, so theoretically it can execute other threads; that means we should be able to create more threads to the system.
That is true and, in certain cases, it might work. However, one needs to consider the following:
- in practice, even I/O consumes some CPU, depending on the type of I/O
- I/O is most of the time a shared resource; that means that it would behave like a lock (or like spinning while as we saw above)
- it is hard to predict the overlapping of CPU work and I/O work, so it can be hard to obtain the expected improvements
So far, in all my experience with threads that do CPU-intensive work and I/O, all I saw was that creating too many such threads would degrade the performance. But that doesn’t mean that there aren’t cases in which this strategy actually works.
With that being said, I would encourage people to treat I/O differently, and, as much as possible, not mix it with CPU-intensive work. Specializing threads/tasks based on their resources constraints is most of the time a good idea.
Conclusions
Try to match the number of threads that do CPU-intensive work with the number of cores.
Try to match the number of threads that do CPU-intensive work with the number of cores.
Considering that we have two hemispheres in our brains, I wanted to make sure the conclusion resonates well in both hemispheres, thus the duplication. ![]()
Keep truthing!
Comments